Something I keep noticing in payment business cases: the cost numbers are usually older than people think.
The figures that get quoted are around $20bn a year, about 3% of revenue, roughly 78% of industry net profit. They come from a study published in 2022, and that study used 2019 data.
A lot has changed since 2019. Channel mix, SCA, instant payments in Europe, wallets now at 56% of global e-commerce value.
IATA published a more recent set this August: $22.2bn of payment cost on $977bn of payment volume for 2023. That works out at 2.27%.
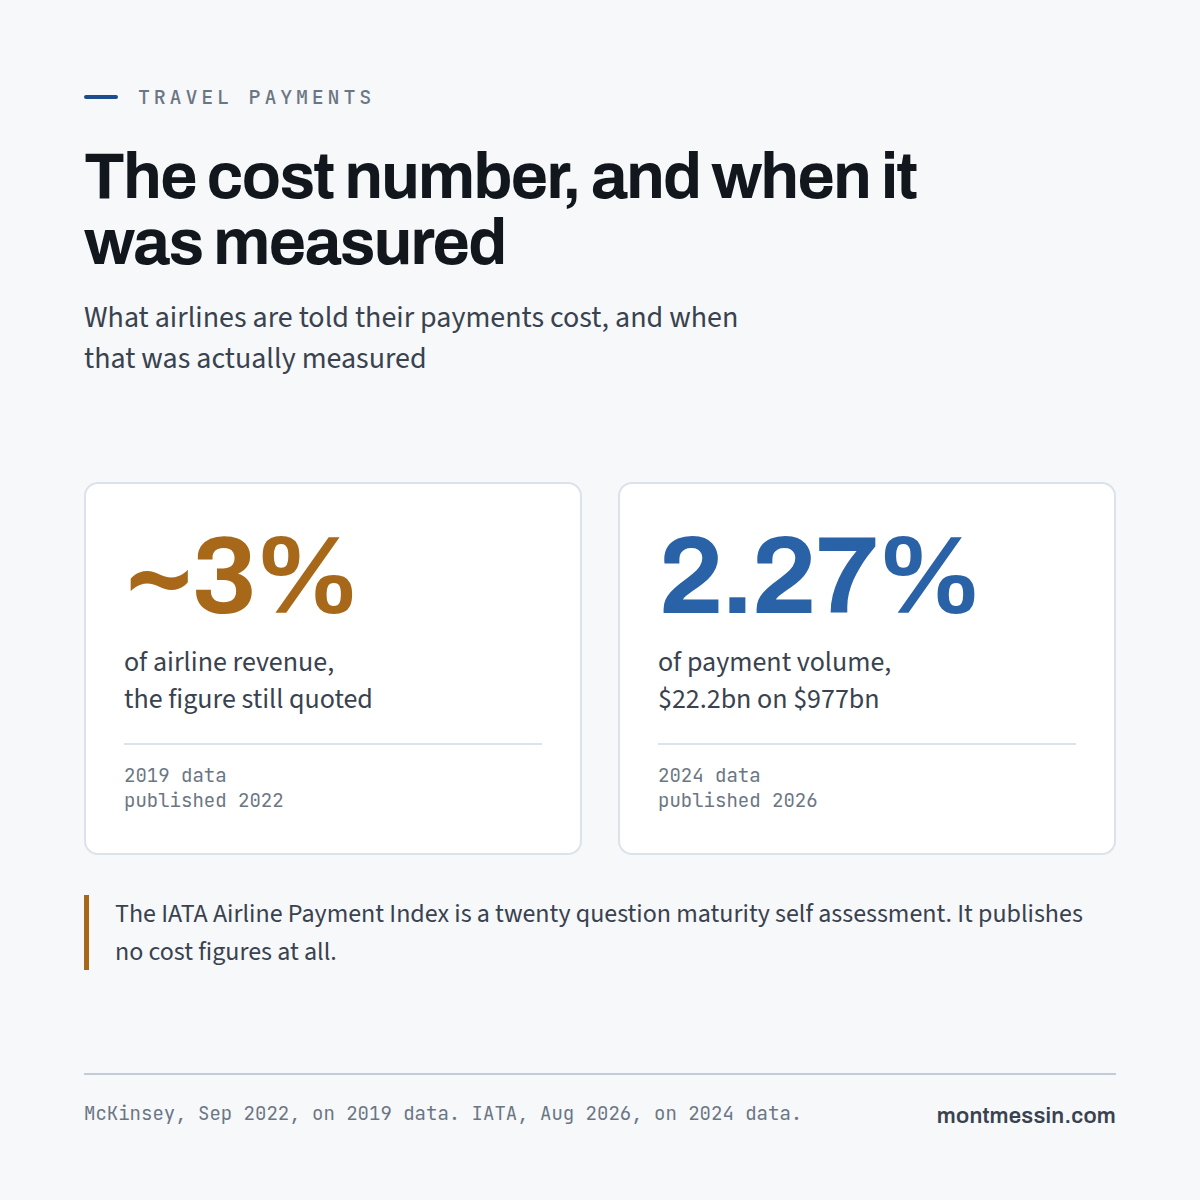
One other thing I have had to correct a few times, including for myself. The IATA Airline Payment Index is not a cost benchmark. It is a twenty question maturity self assessment across four pillars. It does not publish cost figures. It is an easy one to mix up.
I am not saying payment cost stopped mattering. It matters. But it is hard to negotiate against an industry average from seven years ago, and harder still if you do not have your own number next to it.
Cost per transaction, by channel, by market, by method, fully loaded. Very few teams I meet have that in front of them. Travel Payments Explained takes that number apart line by line, which is the method rather than the figure. The ones who do seem to have much better conversations with their providers.
What I left out
The two percentages are not the same measurement. McKinsey's roughly 3% is payment cost as a share of airline revenue. The IATA figure works out at 2.27% of payment volume, which is a different denominator. So the pair does not show costs coming down, and I did not claim it did, but it would be easy to read it that way. What the comparison actually shows is that the number in circulation is old, not that it has fallen.
Added after publication, 30 October 2026
I got one thing wrong in the note I first wrote here. I said the $977bn looked like the old 2019 volume carried over. IATA's release of 27 October says it was 2023 sales. So $22.2bn on $977bn was a 2023 measurement, not old data.
The same release gives 2025: $24.5bn of cost on $1.05tn of sales. Cost went up 10.4% in two years, sales went up 7.7%. As a share of sales, that is 2.27% in 2023 and about 2.33% in 2025. About $5 per passenger, against a forecast net profit of $4.50 per passenger for 2026.
So the cost of payment is not coming down. It is growing faster than the business it serves.
Sources
- $22.2bn of payment cost on $977bn of payment volume for 2023: IATA, 3 August 2026
- $24.5bn of payment cost on $1.05tn of sales in 2025, up 10.4% on 2023 against sales up 7.7%, $977bn of sales in 2023, $5 per passenger against $4.50 forecast net profit for 2026: IATA, 27 October 2026
- Over $20bn a year, about 3% of revenue and about 78% of industry net profit, on 2019 data: McKinsey, 9 September 2022
- The Airline Payment Index is a twenty question, four pillar maturity self assessment: IATA
- Digital wallets at 56% of global e-commerce value, 2025 data: Worldpay and Global Payments, Global Payments Report 2026, published 31 March 2026
The 2.27% is arithmetic on the two IATA figures, not a quoted number.